- Home
- Proposals
- The Arguments
- About Us
- News
- BBC bias on climate change
- Latest News
- Climate change balance lost by BBC
- Energy Prices-The Times
- Turbines trash landscape benefit billionaires
- Global Warming Panic Over!
- Mini-Nukes the future
- The dirty secret of Britain's power madness
- Extreme weather the new Global Warming
- Tax Payers Alliance Energy view
- Britain can't afford wind power
- Fracking = prosperity?
- Its time to drill- Times leader
- Thoughtful article on Fracking
- Wind double subsidised
- Deluded energy policy
- The EU U-turn over energy
- Windfarm Wars Company in Churchover
- New noise guidance increases risk of harm
- Peter Lilley MP, Delingpole's new hero
- Shale Gas update 2013
- Maggie U-turned on Global Warming
- Devastatingly sad news
- 'smart' energy technology
- Engineers surveyed 2011
- Lord Turnbull speaks out
- Miracle shale gas
- Planning application refused!
- Warwickshire heritage beauty spot protected!
- Press
- Articles
- Letters
- How To Help
- Donations
- Letters of Objection
- New Churchover PC Objection
- New Historic England Objection
- Churchover Resident Objection
- CPRE Objection
- English Heritage Objection
- Objection by expert R&F historian
- Leicestershire County Council objection
- Warwicks CC Ecology objection
- Harborough District Objection
- Churchover PC Objection
- Bitteswell PC Objection
- Pailton PC objection
- Some other Objections sent
- Rugby BC Planning Committee
- Contact Us
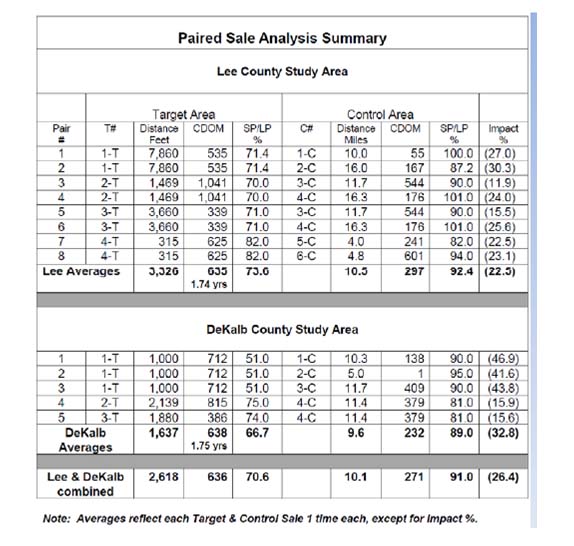
McCann's 26-28% loss in value
ASWAR's summary of Michael McCann's views on updated LBNL report: Don't trust the wind lobby!
To all concerned from Michael McCann:
The new LBNL value report has been placed with many media outlets, as part of the follow up public relations campaign to dismiss value impacts as a mere “concern”, while doing little to address the very real problem. I have received many requests for comment on the latest LBNL effort. A thoughtful review of the claims stated therein is warranted, and my preliminary remarks follow.
First, the August 2013 LBNL report conclusions should not be relied on for any purpose other than showing that statistics can be used to support any biased position they choose, but it is far from being an empirical value study. There was certainly enough data to perform a study that incorporated the accepted methodology of paired sales and/or resale analysis, with careful analysis of marketing times and other value influencing factors. But LBNL once again ignored the primary data source for residential values; the Multiple Listing Service (MLS) active in any given study area. (Marketing times do not show in Assessor data)
Once you bother to read through all the scientific sounding discussion and internally supported citations (Hoen citing Hoen, for example), I recommend that you refer to the last sentence of paragraph 2 on report page # 5, wherein the authors disclose an apparent bias as follows: “Therefore for the purposes of this research we will assume 3-4% is a maximum possible effect.”
Review of Table 7 arrays the data and reveals impact on a factual basis. The empirical evidence is presented on Table 7 before the sale price data was “crunched” to obtain the stated results. On a side note, the focus is on claims of statistical significance; not upon value impact.
Regardless of terminology or focus, the fact is that the raw data shows a post construction negative impact of 28% for homes < 1 mile from turbines vs. homes in the 3-10 mile range, as follows:

Second, the methodology utilized in the LBNL analysis is not an accepted, proven regression model. It pools data from 67 different projects in 27 counties in 9 states, and simply cannot be deemed reliable because of the wide value variations that exist between these local markets. To the contrary, it insures that the variables have such wide variation that any impact measured after running the data through their hedonic “model” will not be able to identify any impact at the level needed to establish statistical significance (see Al Wilson, Rubber Rulers) Click here
In contrast, however, the raw data is substantively significant, as it shows the real market reaction, without any assumptions, alteration or adjustment of the numbers, and no built in bias (i.e., 3% to 4% max impact). http://www.sscnet.ucla.edu/soc/classroom/index.pl?ThreeTypesOfSignificance
Further, given that the Table 7 data includes 1,198 sales located within 1 mile of turbines, and also that it covers 67 different projects, it seems quite clear that there is a high level of casual significance to establish there is a direct relationship between distance and value impact, and these market reactions are commonly repeated throughout the USA.
The attached Rubber Rulers paper by Al Wilson addresses the numerous problems with the 2009 LBNL analysis, and it appears that the majority if not all of these problems are replicated in the 2013 LBNL report. (Note: see Wilson Bio. This professional appraiser literally wrote the book on environmental impact on property values and other value impairment research, statistical standards studies, etc. Click here)
What non-appraisers (i.e. LBNL authors) refer to as “anecdotal” evidence, in their attempts to dismiss actual examples of value loss, is what appraisers refer to as Comparable Sales and other market evidence. From an appraisal perspective, the 1,198 sales within 1 mile that find a 28% loss of value is meaningful, but actual local examples are potentially a higher level of proof. Realtors such as Annie Cool are in the trenches on this issue, and consistently find that buyers will not pay prices that are at “no turbine proximity” value rates, and that most buyers simply will not even make an offer on homes near turbines. Homes that sit on the market for extensive periods of time have downward pressure on list price, and while some owners elect to pull the property off the market rather than accept a large (or total ) loss of equity, others end up selling for whatever the “market” will pay. The 1,198 sales represent a sample of the latter group, and again, show a 28% lower value, on average.
These type of marketing facts are completely ignored in the LBNL studies, which is a major failing of the academic approach to addressing this issue. My own recent study of 13 paired sales in Illinois found marketing times within 1 mile to be exactly 1 year longer than competing homes (paired sales) located an average of 10+ miles away from the turbine projects. (All 2012 sales near turbines were paired with one or two sale further away, but which would otherwise be considered competing homes while on the market)

As an appraiser, I would prefer to have 5 good “comps” than 50,000 meaningless data points. In fact, many billions of dollars in mortgage loans are made across the country on the basis of 3 to 5 good “comps”. But no mortgages or sales will be based on the LBNL report…it is irrelevant for real world purposes.
Third, Assessed values may or may not be accurate. My experience dictates that AV data is not reliable for purposes of establishing value of a given property. It is merely a method of spreading the taxes levied on a supposedly uniform and ad valorem basis across the properties in a given jurisdiction. AV’s may have decreased in some locations while increasing in others, but it seems pretty consistent that Assessor’s Offices are not being compelled to seriously address local impacts from turbines. I have been told by one Assessor that “since none of the properties nearby sold, there is no basis for reducing the values”. This statement was despite the fact that several of the properties in question had been extensively marketed and could not elicit even a single offer at ANY price. Remember, Assessors have a different job than independent appraisers; Assessors are required to assess properties uniformly, whereas appraisers are required to value each property individually and with attention to all relevant factors that affect value. Stocks are a far more “liquid” asset than is real estate typically, as it can be sold in minutes, or days at most. Real estate marketing times are an important component in setting values, and when the asset loses all or virtually all of its liquidity, that is indeed a significant value impact. One might look to foreclosure sale data to support the discount that is needed to attract a buyer of a “problem” property, in a time frame that preserves reasonable liquidity.
Finally, the LBNL study is completely inappropriate as “evidence” for developers to submit to zoning boards, when considering turbine SU permit applications. Typical Zoning Bylaw standards for approval require a finding that the “project” will not have any adverse impact on neighboring property values (as well as the public health, safety & welfare). The LBNL report does not address this standard(s) of approval, but instead attempts to recast the question as whether turbines have a far reaching, uniform and statistically significant impact. Home sales that are not in the neighborhood of turbines are irrelevant, as is whether the impact is widespread or uniform. Zoning regulations require denial of applications when there will be ANY significant adverse impact on neighboring values, and do not provide the right for any development to diminish the value of neighboring property. The regulations also do not typically require a neighboring or abutting property owner to be “pooled” with the level of impact for an entire Town or State. Zoning regulations are intended to preserve values (etc.), but not to create sacrifice zones to accommodate wind energy development.
I trust this will help save a little time in addressing the recycled claims of no value impact from turbines. But if you choose, ignore all opinion and just go to the facts:
1,198 sales within 1 mile of turbines demonstrate a 28% lower value, and the data provides a compelling basis to determine there is a causal relationship between distance and impact.
Regards,
Michael S. McCann
McCann Appraisal, LLC
Chicago, Illinois

